


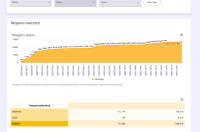
The Response Overview provides a clear and structured view of all collected responses from one or more questionnaires within IT5. It consolidates data into tables, charts, and maps, allowing immediate insight into participation rates and submitted answers.
This chapter explains how to create and configure response overviews. It covers report groups, widgets (such as tables, charts, and text), and how production data is displayed. It also explains how to edit and organize content, and outlines key considerations when sharing response overviews with end users.
Glossary
| Name | Description |
| Report group | A report group is formed by combining one or more response overviews that are linked to one or more questionnaire projects. Data from multiple projects can be presented in a single view through it. |
| Response overview | A response overview displays data using text, charts, and tables. It allows users to present information clearly and customize the layout. |
| Treshold | A predefined minimum number of responses below which answers are hidden or made anonymous to protect respondent privacy. |
| Widget | A widget is a configurable visual element, such as a table or chart, that can be added to a response overview. |
| Sample | A sample contains additional respondent information, such as city or age. This data can be used to tailor questions. Samples can be Production, Test, or Draft, each linked to a single respondent or start code. |
Step 1: Open the response overview
Open the Response Overview module from the Project Portal using the left-hand menu. If no report groups exist, click Add report group to create one.
A report group is defined as the set of one or more questionnaire project(s). A questionnaire project may be included in more than one report group. If report groups have already been created, they are displayed in the table. If no report groups exist, a new one can be created by clicking the Add report group button.
Step 2: Define a report group
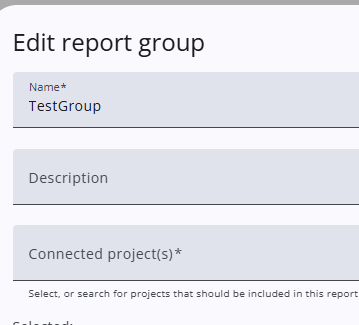
To edit a report group, click the gear icon (Edit report group). To create a new one, select Add report group. In both cases, a window is opened displaying the report group properties, such as the name and connected projects.
One or more response overviews can be added to a report group.
More detailed information about merging multiple projects within a single report group is available here.
Step 3: Define a response overview
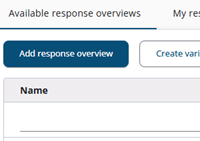
After a report group has been created, one or more response overviews can be added by clicking Add response overview. A dialog is then displayed in which the name and properties are defined. Tables, charts, and other content are configured in the next step.
Other overviews—like a quota group overview—can be created as well. These are explained in more detail here.
Step 4: Edit the response overview details
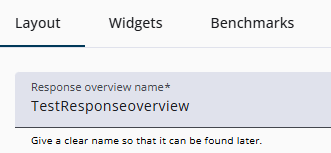
After a report group and its response overviews are created, content can be added by selecting a row in the table or by clicking the Edit icon. A new browser window opens with the Response Overview.
This window contains two main sections. On the left-hand side, navigation tabs such as Layout, Benchmarks, Widgets, Filters and Print are shown and used to add and configure elements like tables and charts. The right-hand side shows the content, including available production data.
4.1: Widgets
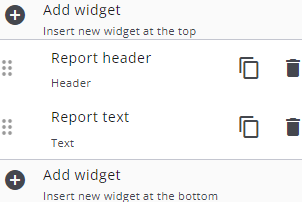
A response overview typically consists of a header, followed by introductory text and one or more data widgets.
Additional text sections and widgets can be added as needed. The list of widgets makes it possible to copy, delete and add elements.
New widgets can be inserted into the overview using the Add Widget option. Widgets can be repositioned by dragging them to the desired location using the six-dot drag handle. Copy and delete actions can be performed using the copy and delete icons.
The different widgets are described in more detail here.
4.2 Benchmark
The documentation for benchmarks is under construction.
4.3 Filters
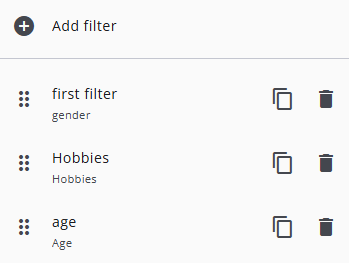
Filters refine the data based on criteria like dates, answers, or sample characteristics. Tables, charts, and maps update automatically, and multiple filters can be combined. Filtered values can also be shown for clarity when exporting or printing.
The different filters and how to use them are described in more detail here.
4.4 Print
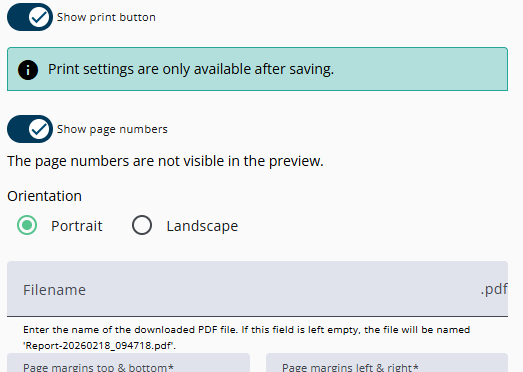
This option is used to configure print settings for the report. Once the toggle is enabled, a range of options becomes available, allowing the page orientation to be adjusted, margins to be set, the visibility of page numbers to be controlled, and other print-related details to be configured to ensure the output meets the requirements.
4.5: The content
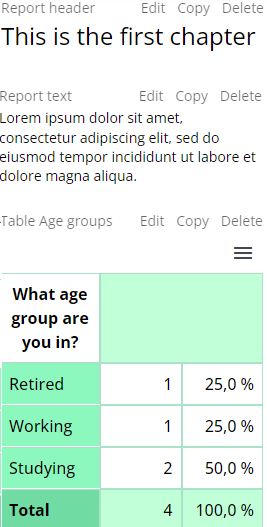
A response overview containing three widgets—a header, a text block, and a table with response data—is shown in the image on the left here.
Each widget can be edited, copied, or deleted using the same options available as in the widget list. The name of each widget is also displayed in this overview, making it easy to locate it in the widget list when changes are required.
An options menu is available for each widget, providing actions such as exporting data, and this menu is also visible to end users who use these reports..
Although not shown in the image, icons on the right-hand side allow the Response Overview to be opened in the Public view mode —without menus, tabs, or navigation elements—and provide an option to return to the report groups.
Please note that threshold rules are not applied for Administrators, including when using the preview. To verify how thresholding behaves, create an SSL link and use it to test the results.
4.6 About the data
Notes on data shown in response overviews:
- Only production data is displayed. Test or draft samples are not included in tables or charts.
- Newly available data may take up to five minutes to appear in the response overview.
- Response overviews must not be used to display privacy-sensitive information or answers when secret shared links are used, as incorrect distribution of such links may lead to unintended data exposure.
- If filtering or slicing results in no available data, an empty graph or table is displayed.
Step 5: Share the report
There are two ways to provide external users—who do not have access to the platform—with access to a Response Overview.
5.1 Access via Shared Secret Link
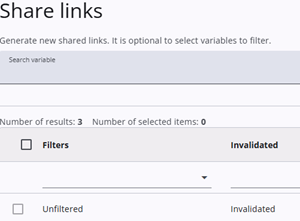
The simplest way to share a Response Overview is through a secret shared link (SSL). SSLs are created in the table with response overviews, and each link is valid only for that specific overview.
Multiple links can be generated, giving direct access without requiring authentication, and multiple people can view the page simultaneously.
Filters can also be applied to SSLs, creating views that show only specific subsets of data. For example, if several organizations contributed sample data, each can be shown only the information relevant to them.
Privacy Considerations
Because SSLs can be forwarded, links may end up with the wrong person. Links can be invalidated and replaced with new ones if needed. To protect privacy, do not include personal information in Response Overviews, and use nested tables carefully to avoid identifying small groups of respondents.
5.2 Invite users
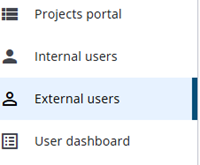
External users can be given limited access to the IT5 software, allowing them to view only the Response Overviews assigned to them. They are invited via the Project Portal in the External Users section.
After registering through a link, they can be assigned to specific response overviews using the Manage user access option in the table.
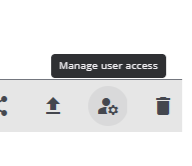
After access has been granted, permissions can be adjusted via Edit user settings in the user list, which can be opened through Manage user access. An end date and visible variables can be defined. Once the end date has passed, access to the assigned Response Overview is automatically removed