


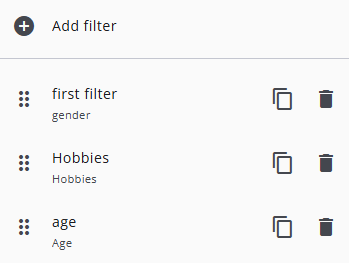
This article contains an overview of filters in the Response Overview module. Filters allow the data shown to be refined based on selected criteria, such as answers, or sample characteristics. Once a filter is applied, all tables, charts, and maps are automatically updated to reflect the filtered dataset.
Add a filter
To add a filter, the Add Filter icon under the Filters tab can be pressed. A name need to be assigned to the filter, and a variable need to be selected. This variable is either a predefined one or another one such as a question or a sample value. Each filter can contain only one variable, but multiple filters can be added to refine the data further.
The selected variable can be modified after creation by editing the filter settings and choosing a different variable. Once saved, the filter will apply the newly selected variable to the displayed data.
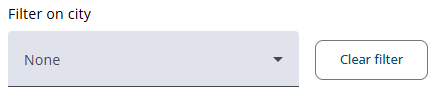
The filters are displayed at the top of the Response Overview, and the values to filter by—or none—can be chosen. The selected filters are applied to all displayed data in the overview, automatically updating tables, charts, and other visualizations.
Note that selecting Date questions is currently not supported. However, filtering by dates can still be achieved indirectly by using calculated questions with expressions.
Filter type
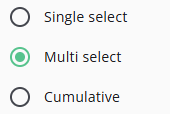
When a new filter is created, it is initially set to the default type: Single select. This type can be changed at any time by editing the filter settings. The table below provides an overview of the available filter types and describes how each one functions.
| Type | Description |
| Single select | Allows only one value to be selected at a time. The option None can also be chosen. |
| Multi select | Displays a list of checkboxes, enabling multiple values to be selected simultaneously. Options to Select all and Deselect all are available. |
| Cumulative | Includes the selected value and all preceding values. This type is most suitable for ordered numerical variables. |
For a Multi select filter, it should be noted that selecting all options is not the same as selecting none. When all options are selected, only cases matching one of those values are included, and empty values are ignored. When no options are selected, all cases are displayed.
Show filters values
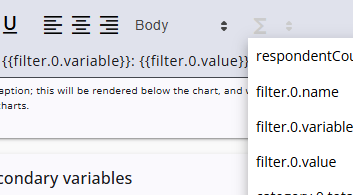
When a PDF is generated from the Response Overview, the interactive filters are not included. To ensure that any applied filter values are visible, it is recommended to display the selected filters within the widget text. This can be done by using the Σ icon in the rich text editor to select the desired filter variable and value.
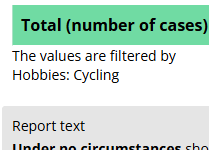
The selected placeholder is inserted between curly brackets ({ and }) and shows the corresponding filter value in the PDF.
The first image shows how filters can be added to the caption, and the second shows how they appear in the report.
Multiple projects
A Report Group can contain multiple projects. If these projects include identical questions, the filter will be applied across all of them. Questions are considered identical when their names, texts, and (if applicable) categories match.