



This article provides a detailed overview of the widgets available in the Response Overview, including tables, charts, and other visual for presenting response data. Additional information about the widgets is provided in the articles listed below.
The Title and Text widgets are not described further, as their purpose and use are self-explanatory.
Icon, Row and Table
 | Icon Highlights a single key metric. |
 | Row Displays multiple widgets side by side. |
 | Table Shows detailed data in rows and columns. |
Charts
This chapter describes how charts can be used to visualize response data in different formats, allowing categories to be compared, progress over time to be tracked, and hierarchical or completion information to be displayed.
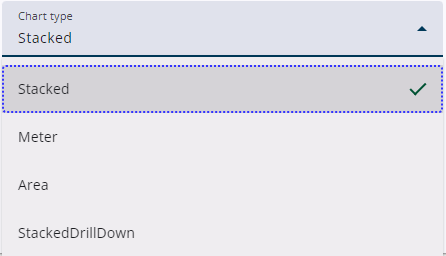
Four different chart types are available: Stacked chart, Meter chart, Area chart, and Stacked drill-down chart. The chart type is not selected when a chart widget is added, but can be chosen later while editing the chart. A dropdown menu under Basic settings is provided for selecting one of these four chart types.
 | Stacked chart Displays categories divided into stacked segments. |
 | Meter chart Circular or semicircular gauge showing different values. |
 | Area chart Displays trends over time as a filled area. |
 | Stacked drill-down Shows progress with expandable hierarchical segments. |
Miscellaneous
 | Settings Basic settings, benchmarks and more. |
 | Placeholders Read more about how to use placeholder in texts. |