


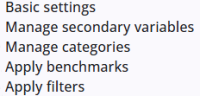
Widgets include several common settings, such as Title, Text, and Categories, which are organized into panels like Basic settings and Apply filters. This article describes these common settings.
Note that the Text, Title, Icon, and Row widgets do not include the panels shown in the image on the left; their settings are displayed in a single list. The Chart and Table widgets have more settings, which are organized into panels.
Basic settings
The table below describes the basic widget settings, such as name and title.
| Setting | Description |
| Chapter name | The name of the widget. |
| Variable | The primary variable used in the widget. |
| Title | The title displayed above the widget. |
| Chart type | For chart widgets only. Choose between Stacked, Meter, Area, and Stacked Drilldown. |
| Caption | The caption displayed below the chart; it is also included in exported charts. |
Manage secondary variables
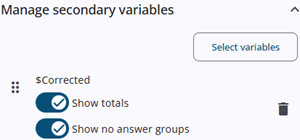
Secondary variables can be added to create nested tables or charts with multiple splits.
For each secondary variable, the totals for the corresponding subgroup can be shown or hidden.
It should be noted that numerical variables can be grouped using intervals, allowing values to be categorized into ranges. These ranges will then start at the lowest value in the dataset.
For example, the response end date can be used as the primary variable, with response status as a secondary variable, allowing the progress of completed cases to be monitored.
Manage categories
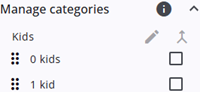
All categories are displayed in this panel (for closed questions).
Categories can be reordered within the list using the drag icon at the beginning of each row.
They can also be edited by selecting one or more categories via the checkbox and clicking the Edit icon. A window is then opened where the label, background colour, and visibility can be adjusted. For merged categories, an option to unmerge is also provided.
Multiple categories can be merged into a single category by selecting them and clicking the Merge icon. A window is opened where the new label and background colour can be defined.
Apply benchmarks
This section is under construction.
Apply filters
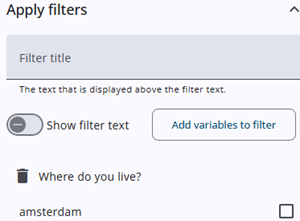
A filter can be applied to the widget to display only the relevant data.
This filter is independent of the filter used in the Response Overview and applies only to the selected widget, without affecting others.