


This article describes the different overviews that can be created within a report group: Response overview, Variables overview, Quota group overview, and Reward group overview. The Response Overview is the most important, as it provides the primary insights into the collected data, while the others offer additional perspectives.

Response overview
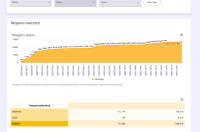
A response overview provides a clear and structured view of all collected responses from one or more questionnaires within IT5. It consolidates data into tables, charts, and maps, allowing immediate insight into participation rates and submitted answers.
Read more
Variables overview
Using the Create variables overview dialog, a list of all (or a subset of) the variables in the project can be generated, with filtering and/or grouping applied as needed. This overview can be used to review the data and quickly verify whether all questions have been answered.
Quota group overview
This generates a simple table showing the current status of all quota groups in the project. It displays how many respondents are assigned to each group, along with the maximum allowed number for each group.
Reward group overview
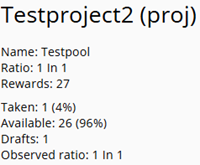
This generates a simple table showing the live status of all reward pools in the project.
It displays the names of the pools, how many rewards have been claimed from each pool, and the corresponding ratio. This provides useful information if adjustments need to be made. See also the article Manage Reward pools where it is explained how to adjust ratios, for example.