


A Stacked drill-down chart provides a clear way to visualize progress across multiple organizational levels while keeping the overall structure visible. Each category appears as a stacked segment that can be expanded, allowing users to drill down into more detailed layers of the data.
This makes it particularly useful for analyzing trends and completion rates within subgroups, while still maintaining an overview of the broader results.

Creating a stacked drill-down chart
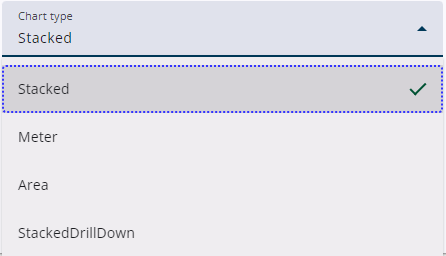
Click the Add widget type icon and select Chart as the widget type. A message will appear indicating that the stacked column chart is the default chart.
This can be changed after saving in the Basic settings panel. See the section below for more information.
Settings
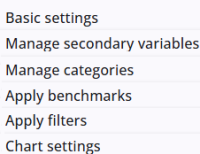
A Stacked drill-down chart widget includes several common settings that are shared across most other widgets, providing consistent functionality and configuration options.
The specific Stacked column chart settings are described in the following section, and a more information about the other settings can be found here.
Stacked chart settings
The Stacked chart widget has several specific settings, which are listed and explained below in separate tables. Some of these settings may also apply to other chart types.
Colours
Set the colours of the bars of the chart here.
| Setting | Description |
| Background colour | Indicates the total scope or maximum value of the segment. It provides the visual baseline against which progress is measured. |
| Progress colour | Indicates the portion of the segment that has been completed or achieved. It overlays the background to show current progress relative to the total. |
Tooltip
Define the tooltip of the chart here.
| Setting | Description |
| Enable tooltip | The chart data tooltip can be enabled or disabled. When enabled, formatting options become visible. |
| Header format | Top part of the tooltip (optional). |
| Point format | Center part of the tooltip (optional). |
| Footer format | Bottom part of the tooltip (optional). |
Expanders
| Setting | Description |
| Show level expander buttons | Enables buttons on chart segments that allow users to drill down to deeper levels of the hierarchy. |
| Level expander label | Specifies the label displayed on buttons that expand a segment to the next level. |
Export menu
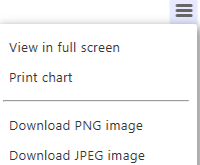
Each chart includes a small menu in the upper-right corner above it, offering several options.
The chart can be printed, or downloaded in formats such as an image or a CSV file (not shown in the image).