


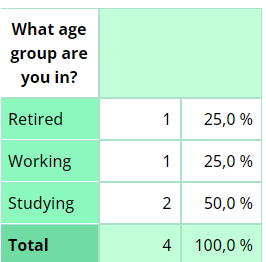
Table widgets can be used to display question answers or variable counts in a structured format. Percentages can be shown horizontally or vertically, or hidden entirely, and totals can also be included for a complete overview.
Tables can include nested tables to show secondary variables, and numeric data or categories can be grouped into intervals—such as age ranges—to make analysis and comparison easier.
Settings
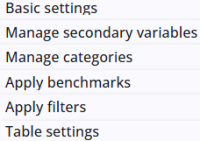
A Table widget includes several common settings that are shared across most other widgets, providing consistent functionality and configuration options.
The specific Table settings are described in the following section, and a more information about the other settings can be found here.
Table settings
The Table widget has only a few specific settings, which are listed and explained below.
| Setting | Description |
| Show percentage | Show a column with percentages. |
| Position of the totals column | Enabled only when a second variable is present, this setting determines the position of the totals column(s), either left or right. |
| Decimals | The number of decimal places to display. |
| Calculate percantages vertically | Choose whether percentages are calculated vertically or horizontally. |
Export menu
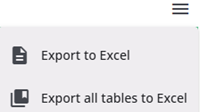
Each table includes a small menu in the upper-right corner above it, offering export options.
This feature allows users to export either the data from a single table or from all tables to Excel.