


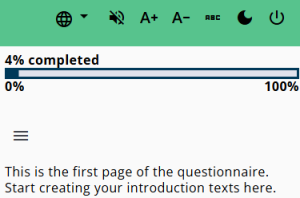
This article describes the progress bar settings for the questionnaire. Displaying a progress bar helps respondents understand how far they have progressed while completing it.
The available configuration options and positioning are outlined below.
Please note that the displayed percentage is an estimate, calculated by dividing the current node by the total number of nodes in the questionnaire. Because conditional routing can affect which questions are shown, the exact number of remaining questions cannot be determined in advance.
Settings
The table below explains the settings of the progress bar. The override endpoint setting is described in more detail.
| Setting | Description |
| Progress bar | Displays the progress bar when enabled (requires the header to be enabled as well). |
| Colour | Sets the colour to either Primary or Accent. |
| Position | Determines placement: above, below, or both above and below the main content. |
| Height | Defines the height of the progress bar in pixels. |
| Overwrite endpoint | Allows the endpoint of the questionnaire to be overridden (see detailed explanation below). |
| Display progression text | Controls whether progress text is shown (options: none or percentage). |
| Position progress text | Sets the position of the progress text: above, below, or outside the bar. |
| Show tooltip | Displays a tooltip when enabled. |
| Extra classes | Allows additional CSS class names. Custom CSS can be added via questionnaire settings (e.g. extra bottom padding). |
Override endpoint
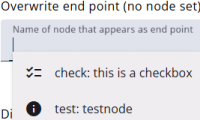
It is possible to override the endpoint of the questionnaire. When questions at the end are only shown to a small group of respondents, a more realistic progress can be displayed for others. To do this, enter the name of a node that appears to all respondents and set it as the new endpoint.
This makes the progress — especially at the beginning — appear higher, which can reduce drop-off. The downside is that the progress bar will show 100% for any questions that follow this new endpoint.