


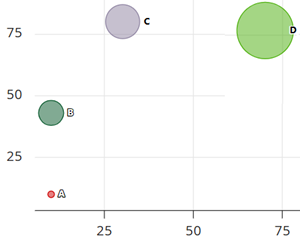
The Bubble chart node type can be used to display values as circless, with the size and position of each bubble representing different variables.
Settings
Several properties, such as Name and Text, are common to all node types. A detailed article describing these common settings can be found at the end. The remaining settings are described below.
Variables or questions can also be included in all expressions. When typing q.. in the expression editor, a list of possible choices is displayed.
| Setting | Description |
| Use colour range | When enabled, a colour range can be set. The range is transformed into a spectrum based on the number of categories. |
| Add colour to range | Set the initial colours of the range and add extra colours if needed. The colour pickers shown below can be used to define the start and end colours. |
| Chart data | The bubbles in the chart are defined here, with a x and y coordinates, a values for the size and name and label. |
| X-Axis | |
| x-axis | Defines the numeric range of the axis using min and max. An optional plotLine can be added as a reference marker at a specific value (position). minLabel and maxLabel describe the meaning of the axis endpoints, helping users interpret low and high values. |
| x-axis title | The title displayed for the x-axis. |
| x-axis plot line text | Under construction. |
| Show labels on axis | When enabled, axis values are displayed; otherwise they are hidden. |
| x-axis label prefix | Text shown before axis values (e.g. Year). |
| x-axis label suffix | Text shown after axis values (e.g. kg). |
| Y-Axis | |
| y-axis | Defines the numeric range of the axis using min and max. An optional plotLine can be added as a reference marker at a specific value (position). minLabel and maxLabel describe the meaning of the axis endpoints, helping users interpret low and high values. |
| y-axis title | The title displayed for the y-axis. |
| y-axis plot line text | Under construction. |
| Show labels on axis | When enabled, axis values are displayed; otherwise they are hidden. |
| Y-axis label prefix | Text shown before axis values (e.g. Year). |
| Y-axis label suffix | Text shown after axis values (e.g. kg). |
| Additional | |
| Show connector | When enabled, a line is drawn connecting all bubbles in the chart. |
| Comment | A text note displayed below the chart. |
Other settings
Click the link below to explore these settings.
 | Common settings Learn more about the common settings of a node. |