


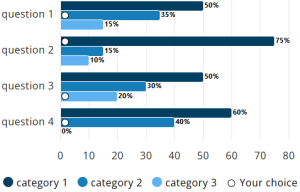
The Column chart node type displays one or more values in a compact visual format.
Different questions and categories can be combined into a single graph, allowing the respondent’s choices to be compared with those of others.
Settings
Several properties, such as Name and Text, are common to all node types. A detailed article describing these common settings can be found at the end. The remaining settings are described below.
Variables or questions can also be included in all expressions. When typing q.. in the expression editor, a list of possible choices is displayed.
| Setting | Description |
| Question height | Defines the vertical height of each question row in the bullet chart. |
| Question width | Defines the width of the question label area on the left side of the chart. |
| Extra chart height | Adds additional vertical space between question rows for improved readability. |
| Thickness of the bars | Controls how thick the bullet bars are displayed, either small, medium, large or extra large. |
| Stacked bar value type | Defines which value type is used for stacking (stacked or percentile). |
| Bullet score shape | Defines the shape used to represent the score marker (diamond or circle). |
| Show numbers on y-axis | When enabled, displays numeric labels along the y-axis. |
| Show legend | When enabled, displays the chart legend. |
| Questions population size (N) | Defines the number of responses used for each question’s results. |
| Use colour range | When enabled, a colour range can be set. The range is transformed into a spectrum based on the number of categories. |
| Add colour to range | Set the initial colours of the range and add extra colours if needed. The colour pickers shown below can be used to define the start and end colours. |
| Questions expression | The expression used to generate or select questions is specified. |
| Categories expression | The expression used to determine categories in the chart is specified. |
| Score expression | Sets the score of the respondent per question (optional). |
| Comment | A text note displayed below the chart. |
Other settings
Click the link below to explore these settings.
 | Common settings Learn more about the common settings of a node. |