


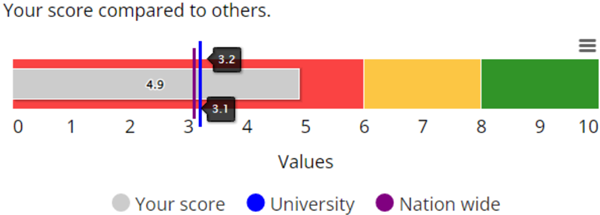
A score component can be used to show how a respondent is performing compared to others. This article describes how score components work and how to use them effectively.
Settings
Several properties, such as Name and Text, are common to all node types. A detailed article describing these common settings can be found at the end. The remaining settings are described below.
Variables or questions can also be included in all expressions. When typing q.. in the expression editor, a list of possible choices is displayed.
| Setting | Description |
| Use colour range | When enabled, a colour range can be set. The range is transformed into a spectrum based on the number of categories. |
| Add colour to range | Set an initial colour range for this node. The colour pickers shown below can be used to define the start and end colours. |
| Score text position with regards to the graph | The score text can be positioned to the left, right, below, or above the graph. |
| Score expression | An expression where a colour, value, and label can be inserted. The score is typically a variable or an answer from one of the questions. |
| Cut-off values expression | The division of the bar into different parts is defined here. Each part has a length and colour, and the start and end of the bar are specified. |
| Reference groups expression | References compared to the respondent can be added. Vertical lines are displayed on the bar to show the scores of other groups. |
| Score label | Defines the label on the x-axis. |
| Comment | A comment displayed below the graph. |
| Show numbers on y-axis | When enabled, numbers are displayed on the y-axis. |
| Show dividing line | Under construction |
| Show legend | Displays a legend beneath the graph. |
Other settings
Click the link below to explore these settings.
 | Common settings Learn more about the common settings of a node. |